n. Visualize Results
In this next section, we’re going to visualize the results of the job we just ran using NCL. NCL will be pre-installed on your Cluster.
-
Connect to the Head node via DCV, following instructions from part h. Connect to the Cluster
-
Open a terminal and install NCL.
cd /shared
mkdir ncl
cd ncl
wget -c https://www.earthsystemgrid.org/api/v1/dataset/ncl.662.dap/file/ncl_ncarg-6.6.2-CentOS7.6_64bit_gnu485.tar.gz
tar -xvf ncl_ncarg-6.6.2-CentOS7.6_64bit_gnu485.tar.gz
export NCARG_ROOT=/shared/ncl
export PATH=$NCARG_ROOT/bin:$PATH
sudo yum install -y -q ncl
- Navigate to the WRF run directory.
cd /shared/conus_12km
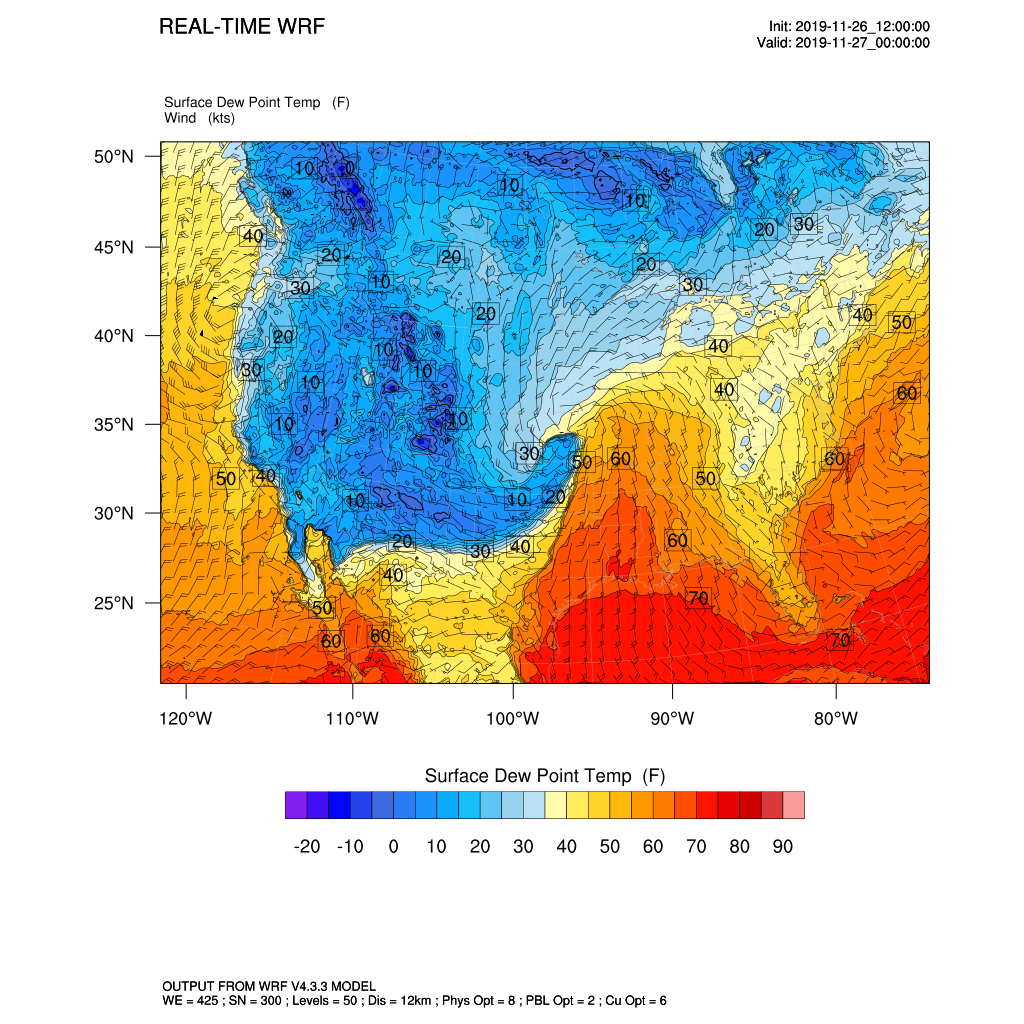
- The provided
ncl_scripts/surface.nclscript will generate two plots of surface fields at valid time 2019-11-27 00:00. Use the space bar to advance to the next plot.
ncl ncl_scripts/surface.ncl
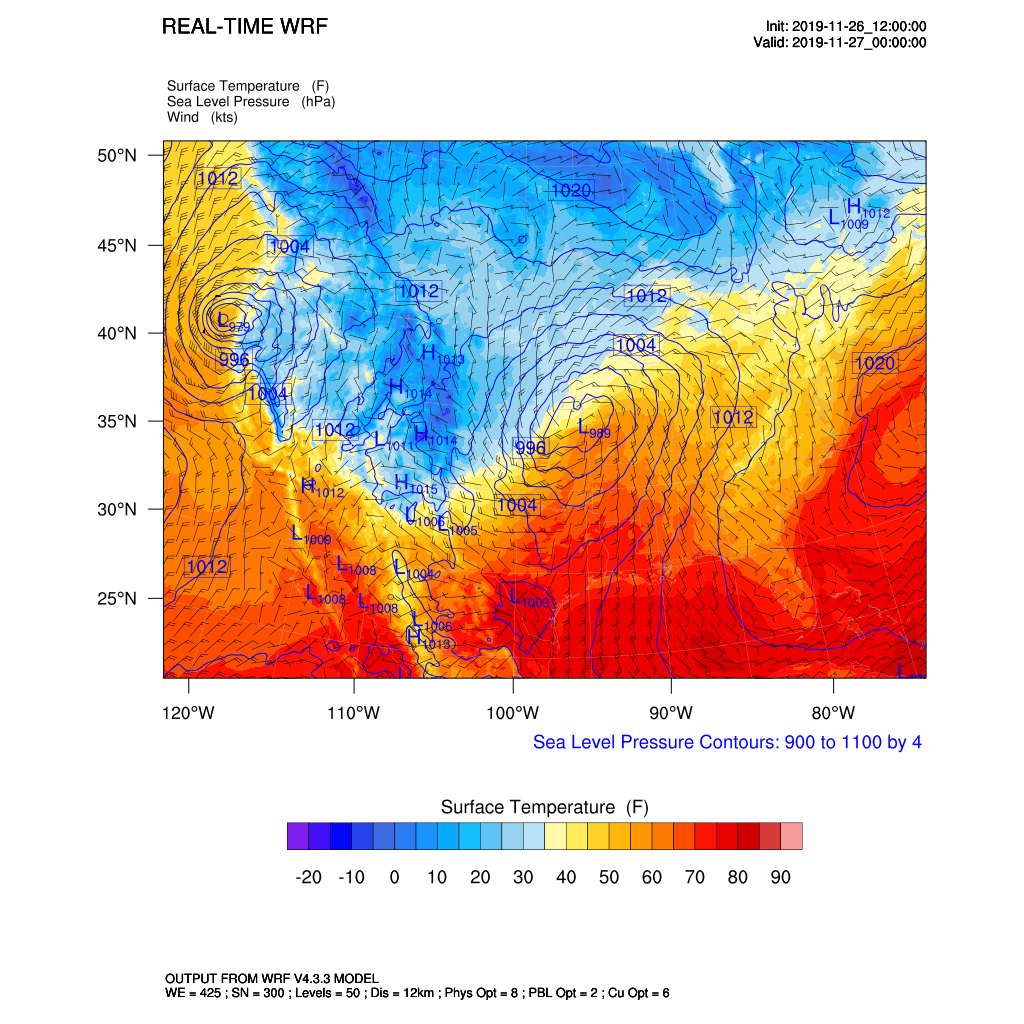
Use the space bar to advance to the next plot.
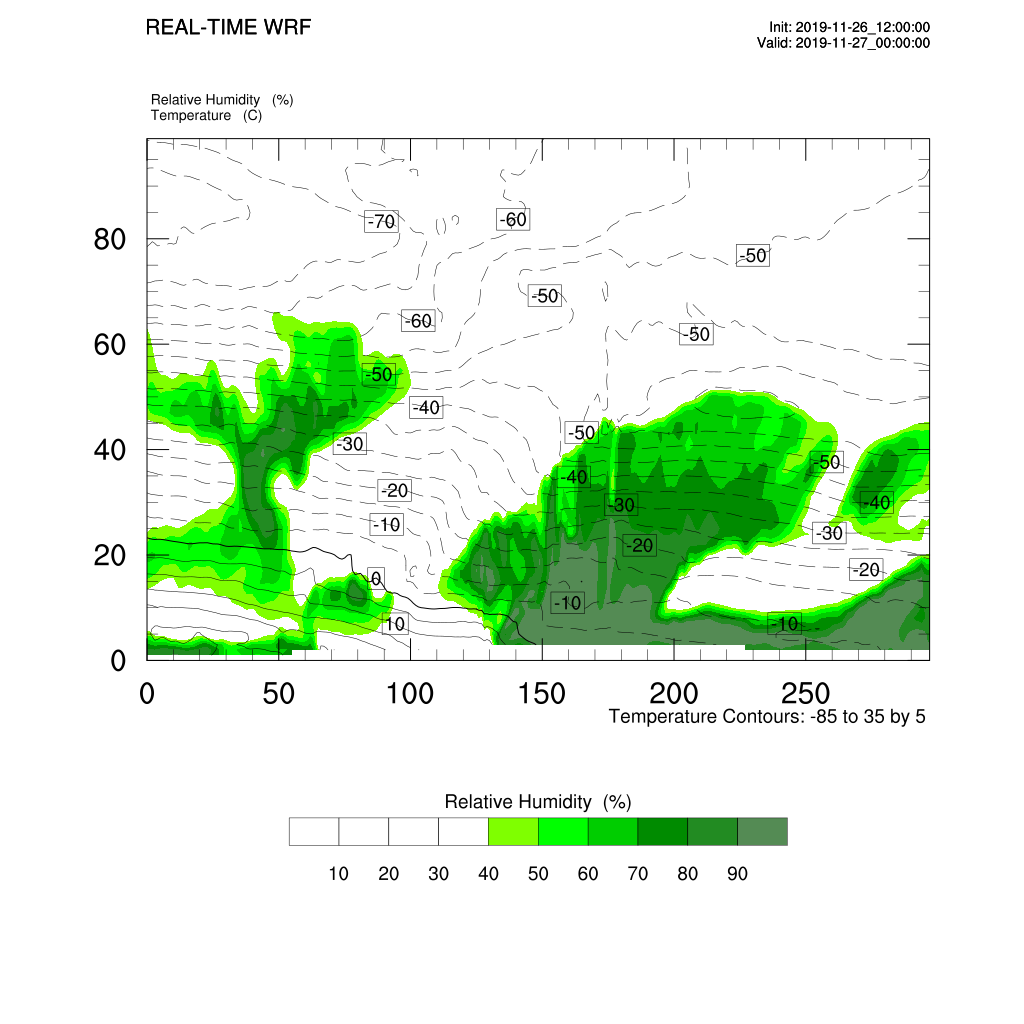
- Generate a vertical profile of relative humidity (%) and temperature (K).
ncl ncl_scripts/vert_crossSection.ncl